Retail Product Placement Verification Guide for 2026
Every CPG brand has two versions of its distribution footprint. There's the one in the retailer portal, the distributor report, and the deck you show the board. And there's the one a shopper actually sees when they walk down the aisle on a Tuesday afternoon.
Retail product placement verification is the discipline of closing the gap between the two. This guide covers what to verify, how to do it at scale across major retailers, and how to turn what you find into fixes before the next reset decides for you.
Why placement verification is a 2026 problem, not a someday problem
Three things changed in the last few years.
First, reorder decisions moved from humans to algorithms. Most large retailers now cut and add SKUs off velocity data with limited buyer review. A product that ships to a store and sits in the back room for a month reads as zero demand, and the system treats it that way.
Second, retail data got faster but not truer. Portals update daily. Syndicated data arrives weekly. Neither can tell you whether the case that "sold in" is on the shelf, facing forward, at the right price. They report inventory position, not shelf reality.
Third, emerging brands are winning distribution faster than they can support it. Going from 300 doors to 3,000 in a year is common now. Field coverage doesn't scale at that pace, so most of those doors go unseen.
The result: brands lose shelf space they earned, months before anyone notices, for reasons that were fixable.
What placement verification actually covers
It's broader than "is my product there." A complete verification program checks five layers.
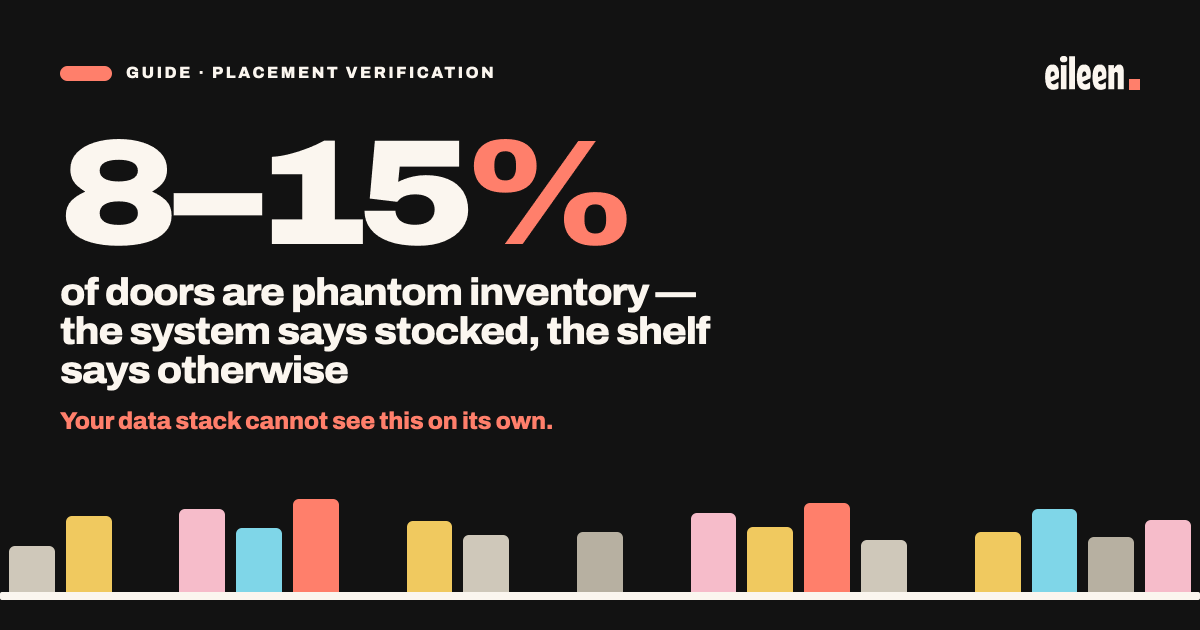
1. Product shelf availability. Is the SKU physically on the shelf right now? Not in the system, not on a truck, on the shelf. This is the foundation, and it's where most brands find their first surprise. Phantom inventory (system says in stock, shelf says otherwise) typically runs 8 to 15 percent of doors in a mature CPG footprint, and higher during rollouts.
2. Planogram and facing compliance. Is the product in its assigned slot with the assigned number of facings? A SKU that's in the store but tucked on the bottom shelf with one facing instead of three at eye level is technically "compliant" in the portal and losing you sales every day.
3. Pricing and tag accuracy. Does the shelf tag match the negotiated price? Is the tag there at all? Is a promo price live when the promo is supposed to be running? Pricing discrepancies are among the most common findings in in-store merchandising audits and the easiest to fix once you can prove them.
4. End-cap and display compliance. You paid for the end-cap, the shipper, the floor display. Did it get built? Is it stocked? Is it still up on day 10 of a 14-day program, or did it get broken down after the weekend? Display compliance is where the largest dollar amounts go unverified.
5. Store rollout verification. When a chain authorizes you in 800 stores, the authorization is a promise, not a placement. Rollouts leak: distribution centers ship late, stores don't pull the case, resets get skipped. Verifying a rollout means confirming, door by door, that the promise became a shelf.
The three ways brands verify today, and where each breaks
1. Retailer portals and distributor reports
What it sees: Shipments, on-hand inventory, point-of-sale
Where it breaks: Reports what the system believes, not the shelf. A starting hypothesis, never ground truth.
2. Field reps and merchandising teams
What it sees: The shelf in depth, plus the ability to fix it on the spot
Where it breaks: Math. A rep covers roughly 10 stores a day and goes where the route goes. In 2,000 doors, a small team sees a fraction per quarter, usually the stores closest to home.
3. Crowdsourced, photo-verified audits
What it sees: The shelf everywhere you're sold, at once, with a timestamped photo per finding
Where it breaks: Shoppers find the problem. They don't fix it.
The brands that verify well in 2026 use all three, in that order: portal data to form the hypothesis, crowdsourced audits to test it everywhere at once, and field resources sent only where the photos show a gap.
How to run a verification program: the five-step playbook
Step 1. Pick the question before you pick the stores.
Vague audits produce vague data. Start with one sharp question tied to a decision you need to make:
- "Did our 600-store Target rollout actually land?"
- "Are the end-caps we paid for at Kroger built and stocked?"
- "Why is velocity flat in the Southeast when distribution grew 40 percent?"
- "Is our shelf tag showing the promo price during the promo?"
One question per campaign. You can run several campaigns; don't blend them.
Step 2. Define what "compliant" means in a photo.
Write the checklist a shopper or rep will follow, and make every item answerable from a picture: product present (yes/no), number of facings, shelf position (top/eye/bottom), tag present and price shown, display present and stocked, competitor adjacency. If a criterion can't be photographed, it can't be verified. Rewrite it until it can.
Step 3. Size the sample to the decision.
You don't need every store to know if a rollout landed. For a go/no-go read on a chain-wide program, 10 to 15 percent of doors spread across regions gives a reliable signal within days. For a claim you're going to bring to a buyer or distributor, audit every store you intend to name. For ongoing monitoring, a rolling monthly sample of 5 to 10 percent catches drift before it compounds.
Step 4. Field it fast, then reconcile against the system.
Speed matters because shelf conditions change weekly. A finding from three weeks ago is a history lesson, not a to-do list. Once results are in, lay the photo data against the portal export store by store. The mismatches are your action list, and the pattern of mismatches (one DC? one region? one retailer banner?) tells you where the breakdown is.
Step 5. Route each finding to the person who can fix it, with the photo attached.
This is where most verification programs die. A spreadsheet of 140 out-of-stocks helps nobody. Sort findings by who owns the fix: store-level issues (missing tags, empty pushers, product in the back) go to your rep or broker with the photo and store number; systemic issues (a DC not shipping, a banner that skipped the reset) go to your buyer or distributor partner as a claim packet with photos, dates, and the dollar impact. Then re-verify. A fix you can't confirm is a fix you can't count on.
Each cycle feeds the next: re-verification results become the baseline for the following campaign.
Verification by retailer type: what to watch for
Mass and club (Walmart, Target, Costco)
Biggest risk: Rollout leakage and modular compliance; resets are rigid and algorithmic
What to weight: Verify within two weeks of a reset date, when placements are most likely wrong and most fixable
Conventional grocery (Kroger banners, Albertsons, regional chains)
Biggest risk: High store-level variance; the same SKU is perfect in one store and missing next door
What to weight: Sample widely and expect problems to cluster rather than spread evenly
Natural and specialty (Whole Foods, Sprouts, independents)
Biggest risk: Tag and price drift; displays built by store staff rather than merchandisers
What to weight: Tag accuracy and display compliance
Beverage alcohol (Total Wine, grocery liquor sets, independents)
Biggest risk: The brand is furthest from the shelf under three-tier; shelf blades and talkers misplaced under a competitor
What to weight: Verify point-of-sale materials as carefully as the product itself
The metrics that matter
Track these across every campaign so you can see trends, not just snapshots.
- On-shelf availability rate: Stores with product visible on shelf ÷ stores audited
- Phantom inventory rate: Stores the system says are in stock but the shelf says otherwise ÷ stores audited
- Facing compliance: Stores meeting planogram facing count ÷ stores audited
- Tag accuracy: Stores with correct price tag present ÷ stores audited
- Display execution rate: Displays built and stocked ÷ displays paid for
- Time to resolution: Days from flagged finding to verified fix
If you only track one, track phantom inventory rate. It's the single number that explains the most unexplained velocity gaps, and it's the one your data stack is structurally unable to see on its own.
Where Eileen fits
Eileen is built for the middle step of the playbook: testing your hypothesis everywhere you're sold, fast. A network of 35,000+ everyday shoppers across all 50 states runs photo-verified, GPS-timestamped shelf checks at $10 a store, with no contract or minimum. Campaigns typically field in a day and return in a few, and every finding carries a photo you can hand to your rep, your broker, or your buyer.
Brands use it to verify rollouts, audit display programs, benchmark against competitors, and confirm that flagged problems actually got fixed. It doesn't replace your field team. It tells your field team where to go.
The 2026 verification checklist
Before your next reset or rollout, make sure you can answer yes to each of these:
- ☐ We have a written, photo-answerable definition of "compliant" for every SKU and display.
- ☐ We verify every major rollout within two weeks of the ship date.
- ☐ We audit paid displays during the program window, not after.
- ☐ We reconcile shelf photos against portal data store by store at least monthly.
- ☐ Every finding is routed to a named owner with the photo attached.
- ☐ We re-verify fixes rather than assuming them.
- ☐ We track phantom inventory rate as a standing KPI.
Retail product placement verification isn't a project you finish. It's the operating habit that separates brands that hold shelf space from brands that wonder where it went.